Metis Project 2
The second project at Metis is our first individual project; only the first project is a group project. It has two goals: get some familiarity the the Dark Arts of web scraping, and apply some set of simple regression models to the resulting dataset and do something interesting with it.
Problem Selection and Data
I got a little intimidated by the suggested parameters of ten features and 10,000 data points. They laid out these suggestions before describing encoding features for categories (dummy variables). I wanted to pick something related to alloy properties, but I didn’t find anything that looked promising in terms of being able to code the mess needed to scrape the data on any kind of reasonable timeframe. I decided to choose baseball statistics, something I definitely have a little domain knowledge about based on my upbringing, time spent in St. Louis, and the bad habit of reading sports blogs I had between about 2005 and 2011.
Trying to shape a problem and practice thinking in a business sense, I gravitated toward looking at revenue, and fell through to considering radio and TV ratings, and finally attendance, since there are actual numbers for that. Revenue is famously hidden, as are ratings data for radio; TV ratings for the regular season, if available at all, are balkanized across every local market. World Series and All-Star Game ratings are available, and the former might even be something of a barometer of the game’s popularity, but there are only data back to the 60s.
I gravitated toward considering averages over the whole of major league baseball, which I would not do again in retrospect. I needed more data points. With a little more time, I could have scraped individual team data.
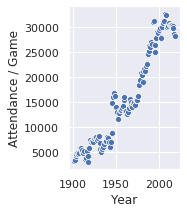
The target I actually chose to regress against was average attendance per game normalized to the U.S. population (the above plot is raw attendance / game). I didn’t do a tremendous amount of thinking about this. At this point I can frame an argument for doing the team level data normalized to their ballpark’s capacity that year. That would have required either finding a dataset with that data or picking it out by hand, which would have taken a while but not forever.
Scraping, Parsing, and Munging / Recombobulating / I Don’t Really Have a Handle on the Lingo Quite Yet
Scraping
https://baseball-reference.com, like a lot of sites, has a split personality between its Terms of Service (drawn up by lawyers?) and its robots.txt (drawn up by the guys in the back?). On my reading of the Terms of Service, even the bit of scraping and storing that I did is technically illegal or at any rate against their expressed wishes. (Sorry.) The robots.txt told me 1) if my name is Skynet or HAL, don’t scrape here (check!) and otherwise 2) wait 3 sec between requests, ok? (Check! That script was EASY to write.)
The end result was a staggering 43 MiB of html gunk when I pickled my gleanings (the response objects for the MLB average pages from the years 1901-2019).
Later on, I pulled some csv tables for attendance and interest-related statistics. I actually had a devil of a time finding a usable table to simply lay out the U.S. population by year for my attendance normalization.
Parsing
So this was about learning Beautiful Soup, which is the ugliest name I can think of for a software library, and that is 100% appropriate for its job of filtering dreck out of HTML. I grew up on a pig farm, and my personal scale of “job enjoyment” has a zero at “scraping frozen manure off of feeders in January.” Let me assure you, the negative area of the scale is populated, and one of the negative values is associated with “staring at the raw HTML from baseball-reference.com to figure out what to ask Beautiful Soup to return for me.” Brain bleeding out ear… yes. Also, there was a mandatory quirk where some rendering engine inserted comment tags <!– –> to shade out some of the tables, but Python string parsing gets rid of that easily enough.
Reconstructing
Once I actually had the data tables, possibly the most interesting part was upgrading my Pandas skills to take apart league average data tables by year of batting, pitching, and fielding stats and reconstructing them into time series.
Regression
I visualized my limited dataset, focusing in particular on seaborn pairplots, nearly choking my poor MacBook Air and forcing me to shift to the desktop with two monitors. I did some linear regressions, did some basic broad-spectrum quadratic feature regressions, then finally went back to my plots and hand-picked several linear and quadratic terms for individual features to shape a final model. I compared the results of Lasso regressions that eliminate features automatically with iterative statsmodels work where I knocked out variables by p-value. This was basically a 21st century version of work I did in 2012-2013 on amphibole chemistry that I plan to blog about another time. As was the case there, I could Choose My Own Adventure by picking different variables to eliminate at each stage.
Ultimately, there are too few data points, too much noise in some variables (walks…) and too much collinearity between other clusters of features. For example: strikeouts, home runs, and average attendance have all tracked upward for basically the entire history of the modern game. (I ended up chopping the 1901-1919 data, the “dead ball” era, because it was too noisy.) Triples and errors have conversely tracked nearly straight down.
Interpretation
Everything else is served with an abundance of salt, for the reasons I just discussed, and more I will mention at the end. Note that I am now normalizing per-game attendance to a U.S. population of 300 million. That is to say, I have taken the league average attendance per game numbers, divided them by the U.S. population that year, then multiplied by 300 million. I don’t have an elaborate defense of any kind for this procedure; I just wanted something that would try to account for at least some external factors besides the changes in the game itself. Again, more below.
First, as I am told MLB has in fact finally chosen to address, the data does suggest that while people have a certain amount of patience for pitching changes, they might be tired of them:
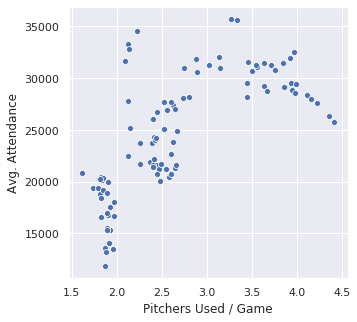
Pitchers used is another statistic that has tracked upward for the entire modern history of the game, so those data points at the right are the recent ones.
Second, people might be tired of waiting through endless plate appearances for one of the Three True Outcomes (strikeout, walk, home run):
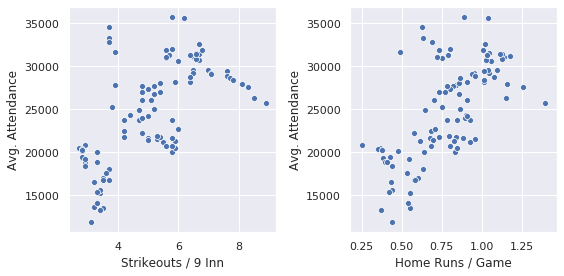
A quadratic term in either SO or pitchers used goes nicely into a regression model over the data. Its negative coefficient explains the appearance of a peak in the dataset… it looks like an inverted parabola from precalculus class. Unfortunately, these features are so collinear that there’s nothing to differentiate them.
Messier, but still tending to show up in regression results:
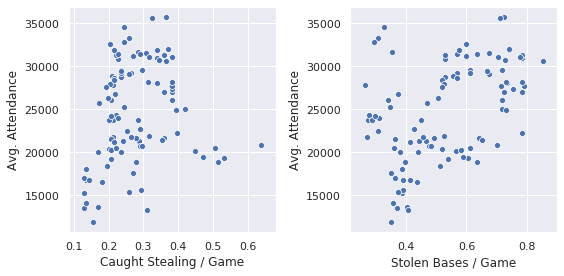
The outliers off to the right mask it, but actually caught stealing was a feature that tended to survive into a lot of final models. It’s counterintuitive (in some sense, caught stealing is a negative, an out imposed on a team choosing to do something stupid on the basepaths) but, then, I care about attendance, and aren’t caught stealing incidences some of the game’s great pieces of theater? Especially if you’re a Cardinals fan, for example, where Yadier Molina has been an integral part of the team’s identity for a long time.
The problem lurking here is that, of course, I’m not taking the size of ballparks into account. My understanding is that average ballpark size peaked somewhere in the Giant Concrete Circle Era of Riverfront Stadium in Cincinnati and Busch II in St. Louis, etc., and now in the Camden Yards Era, it has shrunk considerably. If I throw calendar year in as a feature, regress 1920-2000, and try to predict 2001-2019:
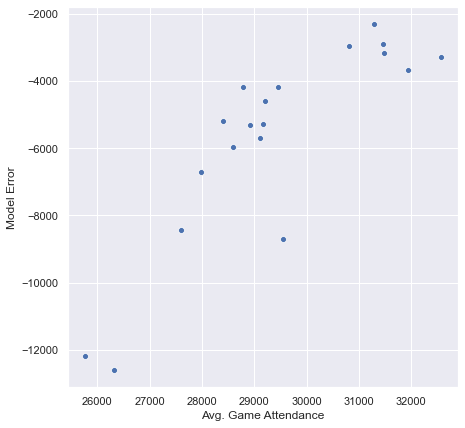
I am badly systematically off. I’m calculating error here as observed - predicted, so the more negative the number, the worse the prediction. I’m further off the smaller the average, and the average has dropped hard the last 15 years. Let’s check a plot of error by year:
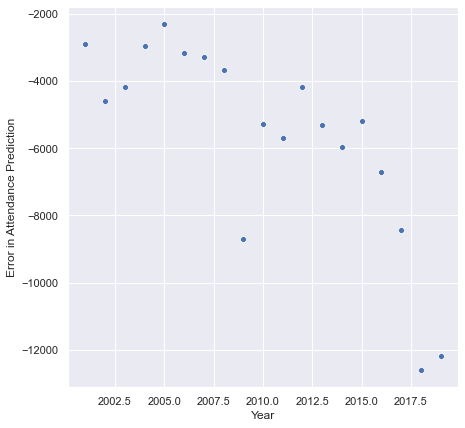
Yeah. The geologist in me shrugs, puts his boots up on the desk, and says, “That’s probably your park size factor.”
I’d redo from start if I had the time…
–PAG
Blogging platform assembled by Jekyll, Poole, and Zach Miller of Metis.